Showing posts with label Gross Domestic Product. Show all posts

Monday, November 17, 2014

Risky Business Monitor: Nov. 17, 2014

Billboarding a project in advance of its completion is a dangerous thing to do in the publishing game, but I anticipate producing three articles about U.S. Federal Reserve policy by this time next week. All these data-intensive pieces will be published at either J.J.’s Risky Business or Seeking Alpha.

Meanwhile, I briefly covered the Group of 20 leaders’ communiqué issued at the conclusion of their two-day summit in Brisbane, Australia, in “G-20 Aims To Boost Its GDP 2% By 2018” at the International Business Times Sunday. As noted in the story: “U.K. Prime Minister David Cameron at the summit pledged to put ‘rocket boosters’ behind a plan for [a European Union]-U.S. free-trade agreement, BBC News reported. Cameron said EU and U.S. leaders all agreed the Transatlantic Trade and Investment Partnership, or TTIP, ‘is a deal we want.’” An EU-U.S. free-trade agreement on rocket boosters: What could possibly go wrong?

Related Reading


Shameless Self-Promotion! If you like my work, then you can follow me as J.J. McGrath at Google+ and Seeking Alpha, as JJMcGrath at StockTwits and @JJMcGrath3000 at Twitter. If you do not like my work, then you can follow me at all those places, anyway.

Thursday, September 22, 2011

'Operation Twist I' and SPX Behavior

A half-century ago, the U.S. Department of the Treasury and Federal Reserve conducted "Operation Twist I" under economic conditions described well by Titan Alon and Eric Swanson last April 25 in their "Operation Twist and the Effect of Large-Scale Asset Purchases," which I mentioned in "Go, Chubby, Go: Let's Twist Again!" this week.

Yesterday, the Federal Open Market Committee (FOMC) announced "Operation Twist II" under economic conditions described well in an many places virtually every day, including this very blog (e.g., "GDP Slide Signals Recession. Soon.").

There are similarities and differences in the U.S. economic conditions existing during the two periods. One obvious similarity centers on the status of the business cycle, meaning the above-referenced R-word was or is on almost everybody's lips in both cases. One obvious difference centers on the country's debt as a percentage of gross domestic product, which was not too bad in 1961 but is not too good in 2011.

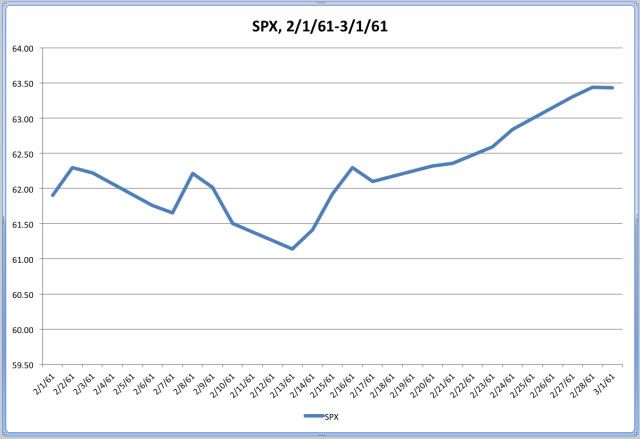
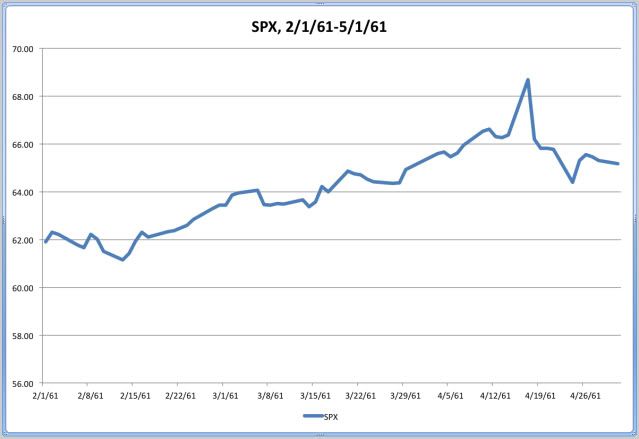
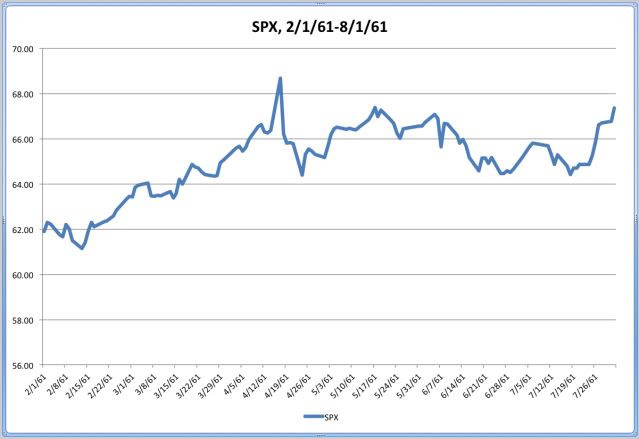
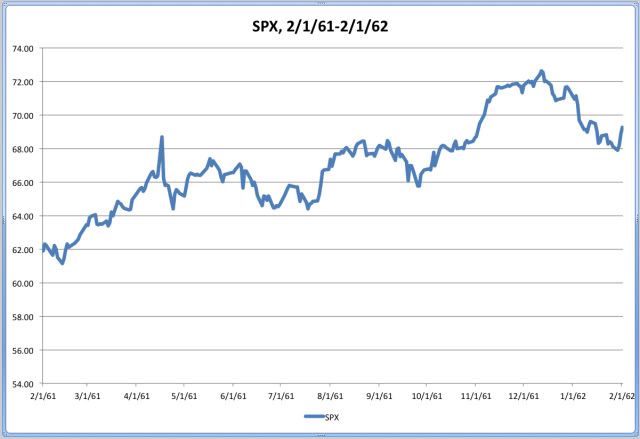
Given this mishmash, it may or may not be helpful to examine the market performance of the Standard & Poor's (S&P) 500 (SPX) in the wake of the launch of "Operation Twist I" on Feb. 2, 1961. But I did it, anyway.

With a common baseline of Feb. 1, 1961, the four charts below show the S&P 500's behavior during the following one-month, three-month, six-month, and one-year periods, respectively:


Source: Risky Business Charts Based on Yahoo! Finance Adjusted Closing-Price Data

If past is prologue, then the recent equity-market crash may be comparatively short-lived. After all, the Fed will be driving financial-market participants out of the long end and into the short end of the U.S. Treasury yield curve, as well as higher-risk assets.

If past is not prologue, then the recent stock-market crash may be relatively long-lived. Clearly, aggregate demand is lacking in the U.S., and nearly all available evidence indicates this circumstance is other than either a local or a temporary phenomenon.

You pays your money, and you takes your chances.

Tuesday, September 20, 2011

You Say To-may-to, I Say To-mah-to

In "GDP Slide Signals Recession. Soon." on Sunday, I indicated my fact-based opinion is that the U.S. economy either has shifted or is shifting to contraction from expansion.

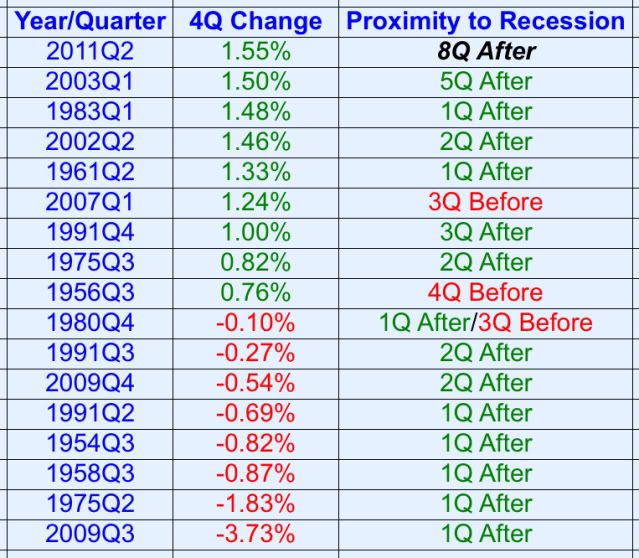
One key factor in the forming of this opinion is the anemic 1.55% change in real gross domestic product (GDP) recorded during the most recently reported four-quarter period (i.e., between the third quarter of last year and the second quarter of this year.).

Support for this notion can be found in Forecasting Recessions Using Stall Speeds, a Federal Reserve Board staff working paper authored by Jeremy J. Nalewaik that was published last April 14.

According to Nalewaik: "This paper presents evidence that the economic stall speed concept has some empirical content, and can be moderately useful in forecasting recessions. Specifically, output tends to transition to a slow-growth phase at the end of expansions before falling into a recession."

Of course, the Washington-based economist adds, "[M]odels using output growth alone produce a considerable number of false positive recession signals, [so] adding the slope of the yield curve, the percent change in housing starts, and the change in the unemployment rate to the model reduces false positives and improves recession forecasting."

Meanwhile, Nalewaik contends, "GDI [gross domestic income] provides a better measure of output growth than GDP, its better-known counterpart, and in our work here, while stall phases are evident in GDP, they are more plainly visible in GDI."

Harrumph.

Sunday, September 18, 2011

GDP Slide Signals Recession. Soon.

If the U.S. economy has not already moved to contraction from expansion, then I believe there is a high probability it will make the transition by the close of the first half of next year.

Moreover, I think there is an intermediate probability this event will be a fait accompli by the end of the second half of this year.

One reason I reached these conclusions centers on my recent historical statistical study of the real gross domestic product (GDP) data series publicly available on the Department of Commerce's Bureau of Economic Analysis (BEA) Web site.

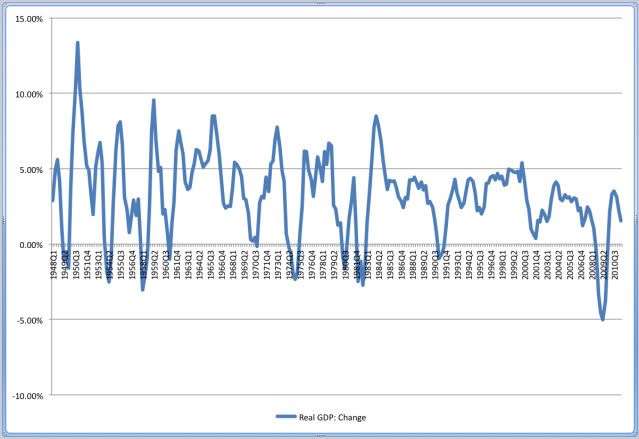
Methodologically, I began by calculating the percentage change in real GDP for each rolling four-quarter period in the quarterly data series, which ranges between 1947's first quarter (1947Q1) and 2011's second quarter (2011Q2). Naturally, the 1947 data constitute the baseline. Below is a chart with an overview of the results of these calculations:

Real GDP: Percentage Change During Rolling
Four-Quarter (4Q) Periods, 1948Q1-2011Q2


Source: Risky Business Analysis and Chart Based on BEA Data

Basically, there are 254 data points in the series. The median value is 3.18%, the mean value is 3.25%, and the standard deviation is 2.76%.

Employing the most recently recorded value of 1.55% as my dividing line, I found 197 data points are higher and 56 data points are lower.

For the purpose of this study, I was uninterested in the comparatively high 197 values, but I was interested in the relatively low 56 values, which I examined in terms of their proximity to U.S. economic contractions as determined by the National Bureau of Economic Research's Business Cycle Dating Committee.

I found 40 of them were registered during recessions and 16 of them were registered within five quarters of recessions (i.e., either before or after contractions). Both the latter group of data points and the most recently recorded value of 1.55% are shown in the following table:

Real GDP: Percentage Change Over Rolling
4Q Periods and Proximity to Recession, 17 Quarters


Source: Risky Business Analysis and Table Based on BEA Data

Based not only on the data I have examined in this table in particular but also on the data I have examined in this study in general -- as well as other sources, such as the proprietary U.S. Economic Index (USEI) discussed in "You Got to Know When to Hold 'em" -- I am convinced the most recently recorded value of 1.55% is more likely to be associated with the next recession than it is to be associated with the last recession.

Could my conviction be misplaced? Sure. For example, I remember well the 2004 New York Yankees, unique in the annals of Major League Baseball as the only team to lose a seven-game playoff series subsequent to taking a 3-0 lead in the same series (i.e., there are no sure things -- not in baseball, not in the economy, not in the financial markets, and not in life).